
Each iteration of the American Municipal Officials Survey includes different projects and survey questions. Below are some of the results from the 2016 AMOS, which was conducted in the summer of that year. In total, about 4,100 officials from all different types of municipalities from across the U.S. participated in the survey.
Top Issues for Officials
QUESTION: “What is the most pressing issue facing your municipality today?”
| Freq. | % | |
| Improving education | 113 | 2.7 |
| Economic development | 1386 | 33.5 |
| Fragile fiscal health | 361 | 8.7 |
| Extreme weather and environmental issues | 57 | 1.4 |
| Public health (including obesity) | 24 | 0.6 |
| Deteriorating transportation infrastructure | 539 | 13.0 |
| Affordable housing | 361 | 8.7 |
| Crime | 99 | 2.4 |
| A lack of trust in government | 225 | 5.4 |
| Preemption (i.e., state passing laws to restrict what we can pass) | 333 | 8.1 |
| Other | 553 | 13.4 |
| Skipped Question | 84 | 2.0 |
| Total | 4,135 | 100.0 |
Pre-Emption from State Legislatures
The term “preemption” refers to situations in which a law passed by a higher authority takes precedence over a law passed by a lower one. Pre-emption of municipal authority through the passage of state laws is a growing issue of concern for many municipalities and political observers. We are in the process of examining where pre-emption is more likely to occur and which types of cities are more likely to be affected by it.
To begin examining this issue, we asked the following:
QUESTION: “In your time as a municipal official, has the state legislature ever tried to enact legislation that would preempt a law passed by your municipality?”
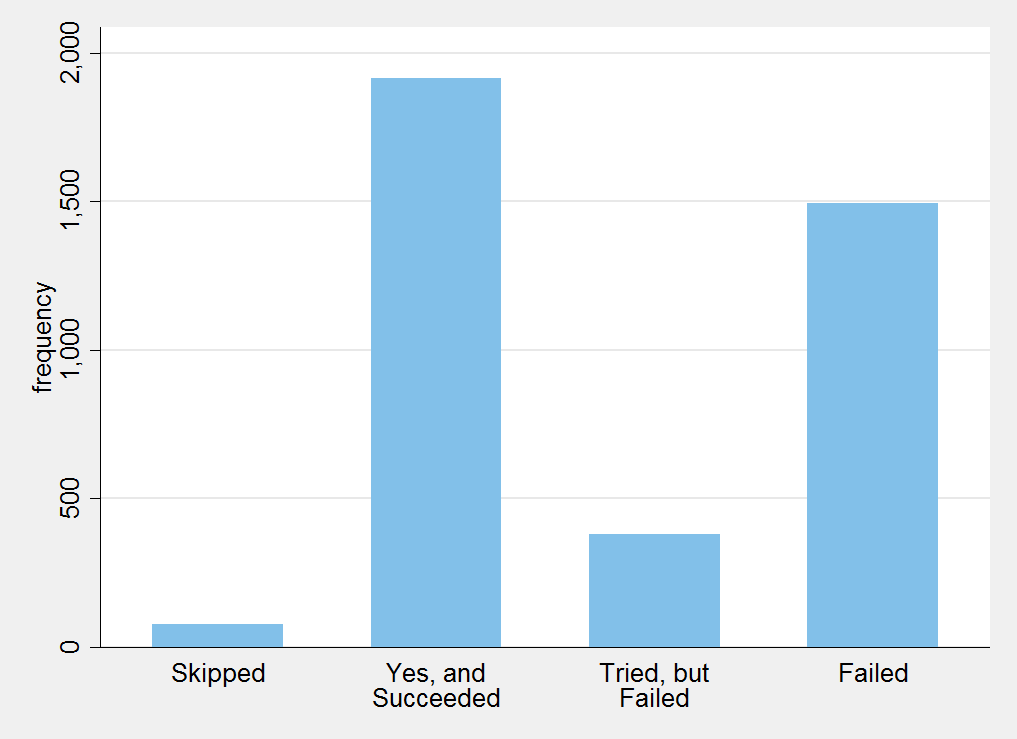
Among those who answered, 51% indicated that the state legislature had succeeded at preempting their municipality. Another 10% indicated that their state legislature had attempted to do so, but failed.
We also asked officials to indicate the issues on which they were preempted.
QUESTION: “On what issue areas did the state legislature preempt (or attempt to preempt) your municipality? (Select all that apply)”
| Freq. | % | |
| Gun rights / ownership | 419 | 12.1 |
| Labor laws / employee benefits (like minimum wage or paid leave) | 624 | 17.9 |
| Zoning and land use | 1,113 | 31.3 |
| Environmental issues | 753 | 21.4 |
| Taxes | 1,002 | 28.3 |
| Non-discrimination / LGBTQ issues | 243 | 7.0 |
| Other | 677 | 19.3 |
The Influence of Surveys and Hearings on Officials’ Decision-Making
In the 2012, 2014, and 2016 AMOS, we presented officials with hypothetical situations to examine their decision-making under different conditions. In the 2016 AMOS, one of these situations examined how public opinion manifested in two different ways (survey results and/or a public hearing) affects municipal officials’ vote on a land use issue. In the scenario we presented, each respondent would see a slightly different version of the scenario, which allows to examine how changing the situation affects their responses.
A major question in political science considers the reasons why and the extent to which elected officials are responsive (or not) to their constituents’ preferences. This gets at a central function of representative democracy. Most work on how elected officials represent their constituents comes from work on national and state politics. AMOS has allowed us to begin to examine this issue more in-depth in local politics.
The scenario told respondents to suppose their municipality was considering whether or not to allow for additional retail development on a particular property. They were also informed that local business people mostly favored the proposal, and that their municipality’s staff said it was feasible. Respondents were then informed that either there was a public hearing on the matter, or their was a survey on public opinion, or both. We also varied whether 75% of citizens in either the public hearing or survey supported or opposed the additional retail development. After presenting the scenario, we asked the respondents the following:
QUESTION: “Given what you know about this situation, how likely are you to vote in FAVOR of the proposal? (Use the bar to indicate the probability (from 0 to 100% chance) that you would vote in favor of the proposal.)”
The figure below indicates the mean probability that respondents in each specific version of the scenario would vote in favor of the proposal to allow for additional retail development.
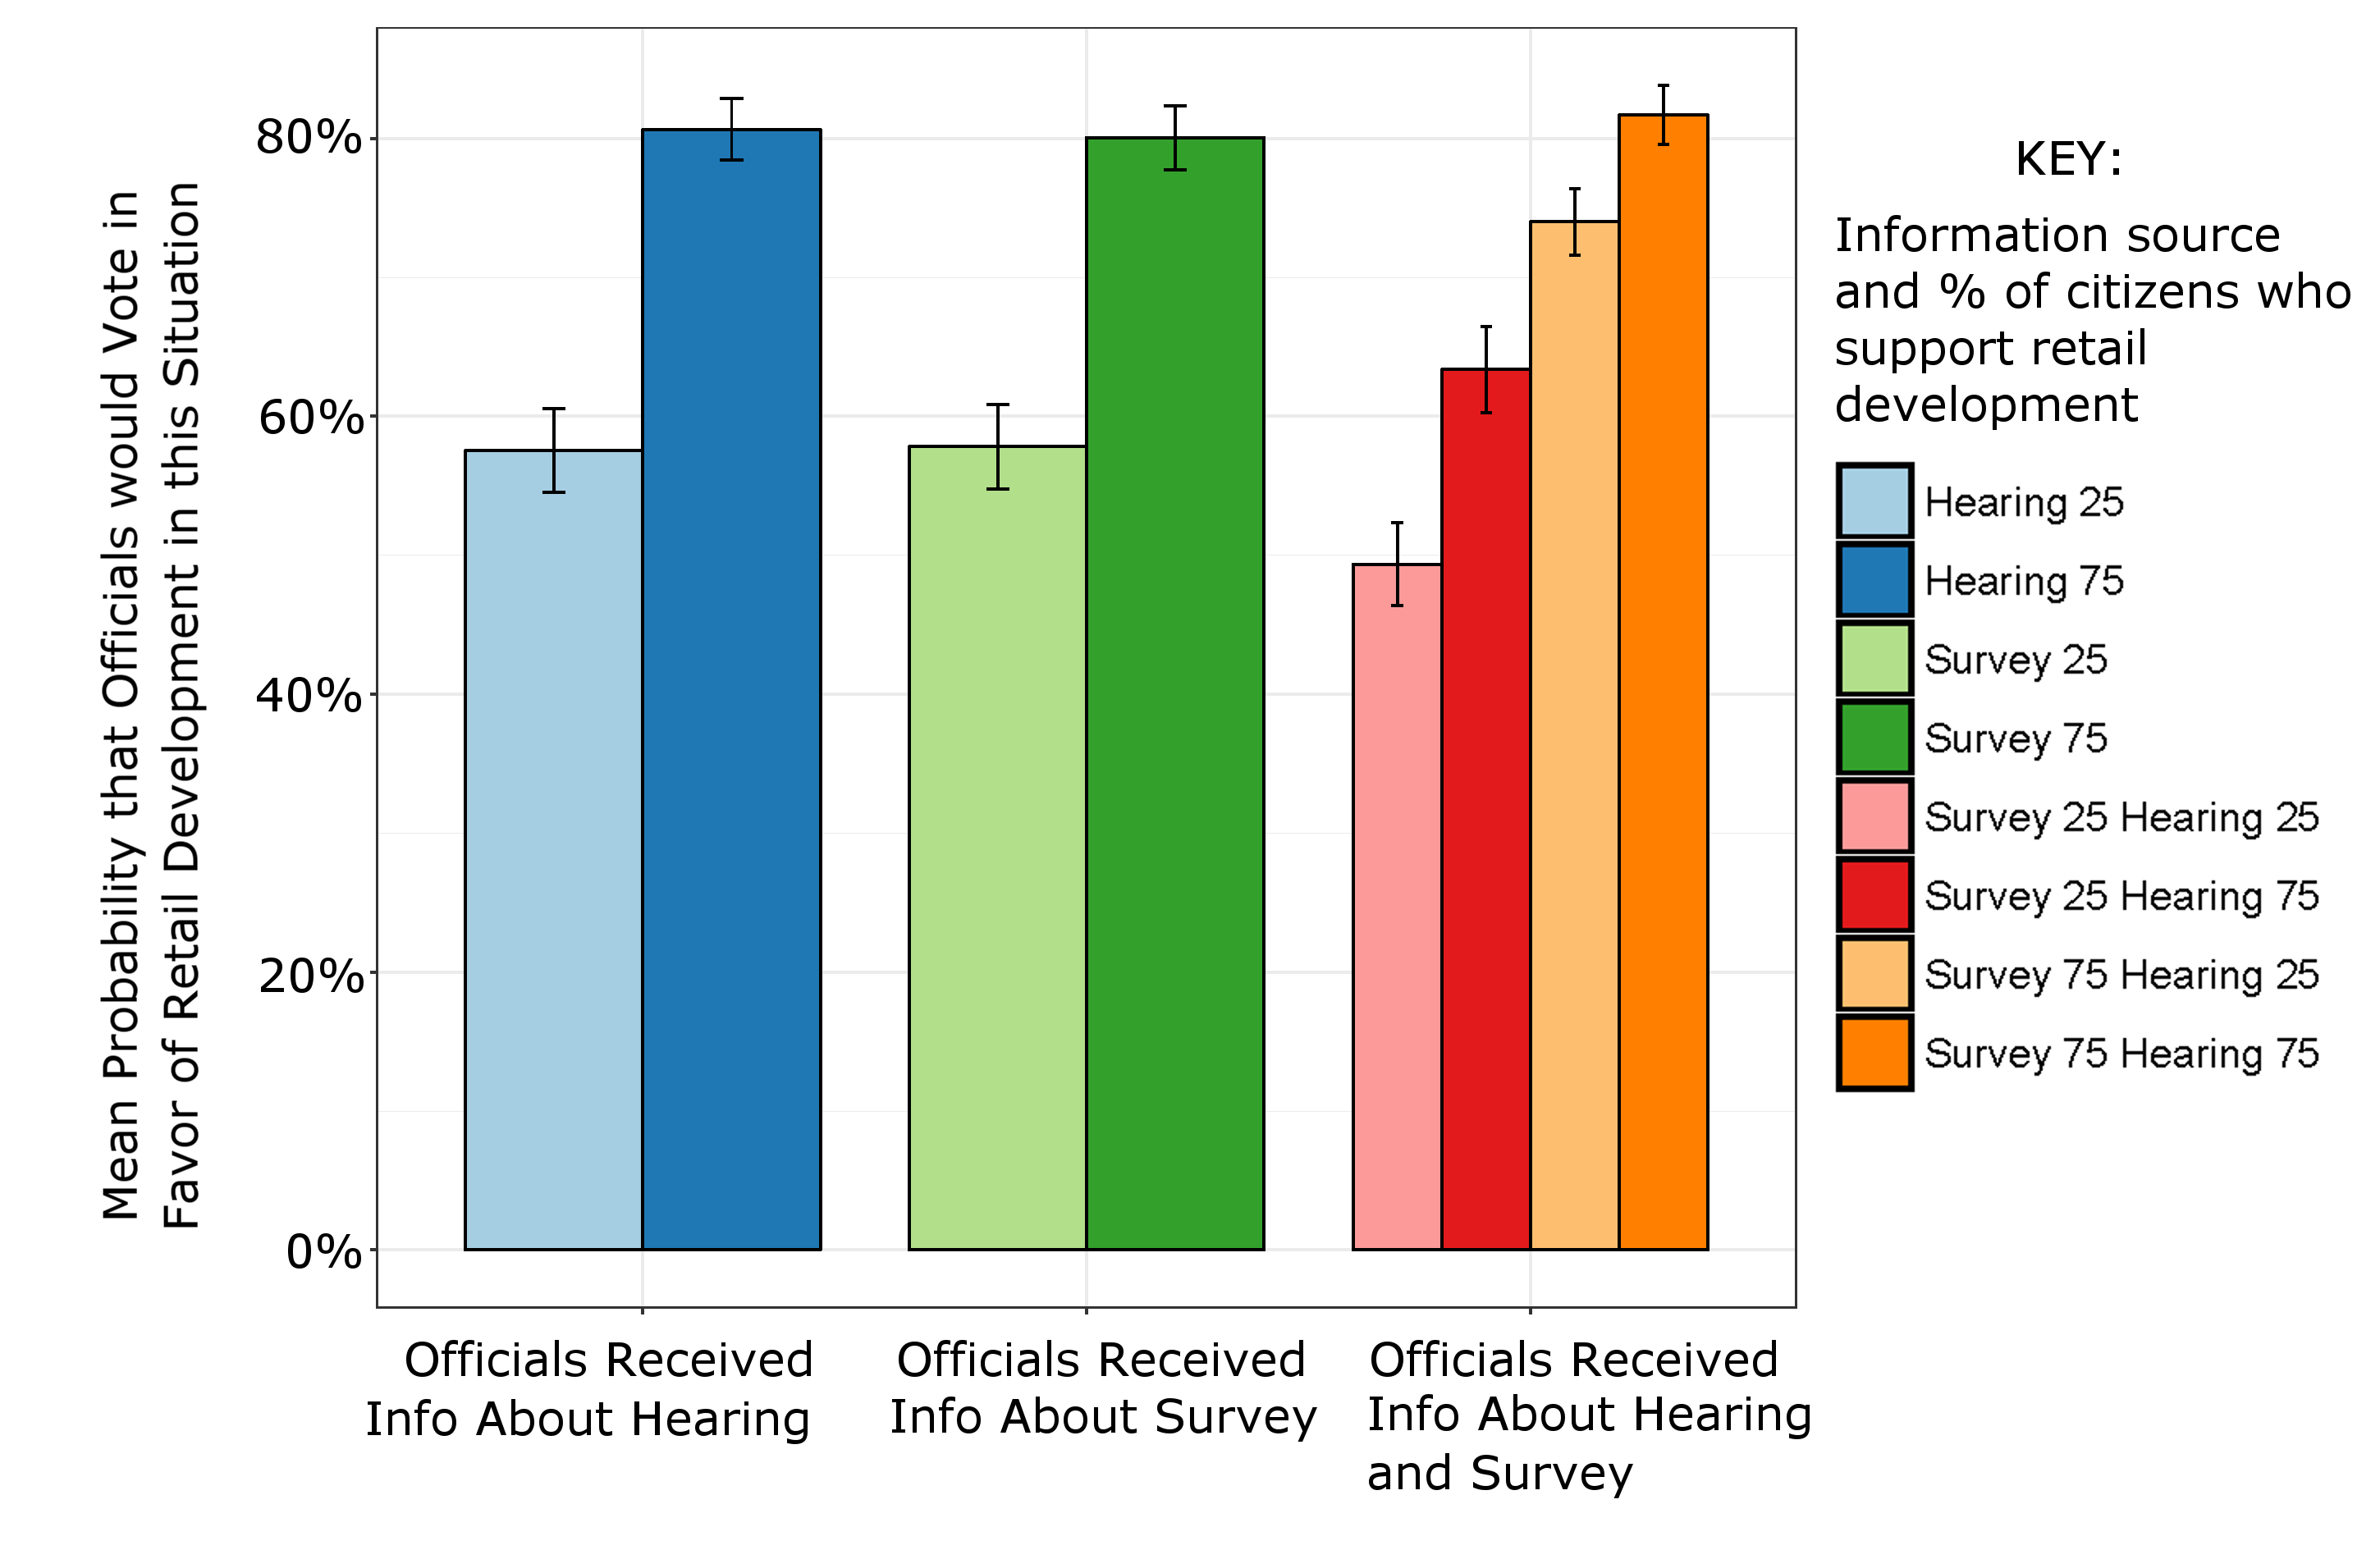
Overall, the results indicate that local officials are slightly more likely to vote for a retail development even when their constituents (as expressed via a survey or public hearing) are opposed. However, when public opinion is in favor of the proposal, they’re much likelier to vote for the proposal. The blue bars show the results among respondents who only saw information about public opinion as expressed in a public hearing on the proposal. The green bars are for those who only saw a scenario that mentioned the survey results. The red and orange bars show the results for respondents who saw both. Overall, they indicate that survey results and public hearings have similar affects on local officials’ decision-making. However, when officials see both survey and public hearing data (red and orange bars), they’re influenced slightly more by the survey results than opinions expressed at the public hearing, which makes sense since officials indicated in the survey that they realize that the opinions expressed in public hearings usually aren’t representative of the citizenry, at-large.
Ambitions for Higher Office
To understand who runs for office and why, we have to understand who has political ambition. Studying the ambitions of local officials is helpful on this front both because local officials had to have some political ambitions to run in the first place and because they’re are a likely pool of candidates for higher office. Here’s what we found out about local officials’ ambitions for running for higher office:
QUESTION (Rows): “Which best characterizes your attitudes toward running for a higher office in the future?”
QUESTION (Columns): “Check the level of government of any offices (besides your current one) that you might ever be interested in running for.”
| Overall Response | Level Might Run (%) | |||||
| Freq. | % | Local | State | National | ||
| Highest Ambition | 1) “It is something I definitely would like to undertake in the future.” | 466 | 12.7 | 60.9 | 57.6 | 23.6 |
| 2) “It is something I might undertake if the opportunity presented itself.” | 927 | 25.2 | 56.2 | 65.2 | 20.4 | |
| 3) “I would not rule it out forever, but I currently have no interest.” | 1,580 | 43.0 | 62.5 | 45.0 | 8.6 | |
| Lowest Ambition | 4) “It is something I would absolutely never do.” | 704 | 19.2 | 35.8 | 4.2 | 0.8 |
| TOTAL | 3,677 | |||||
Personality and Ambition
There is a vast amount of work in political science on how personality traits affect (or at least predict) political behavior among voters. Very little, however, is known about the personality traits of elected officials. In the 2016 AMOS, we administered a classic personality test to municipal officials, which measures individuals on five key traits, which social scientists refer to as the Big 5. These traits are:
- openness to experience (which can be though of as a preference for variety),
- conscientiousness (a preference for duty),
- extraversion (a preference for positive attention),
- agreeableness (a preferences for social harmony), and
- neuroticism (a preference for loss aversion), which is also discussed in terms of its opposite: emotional stability.
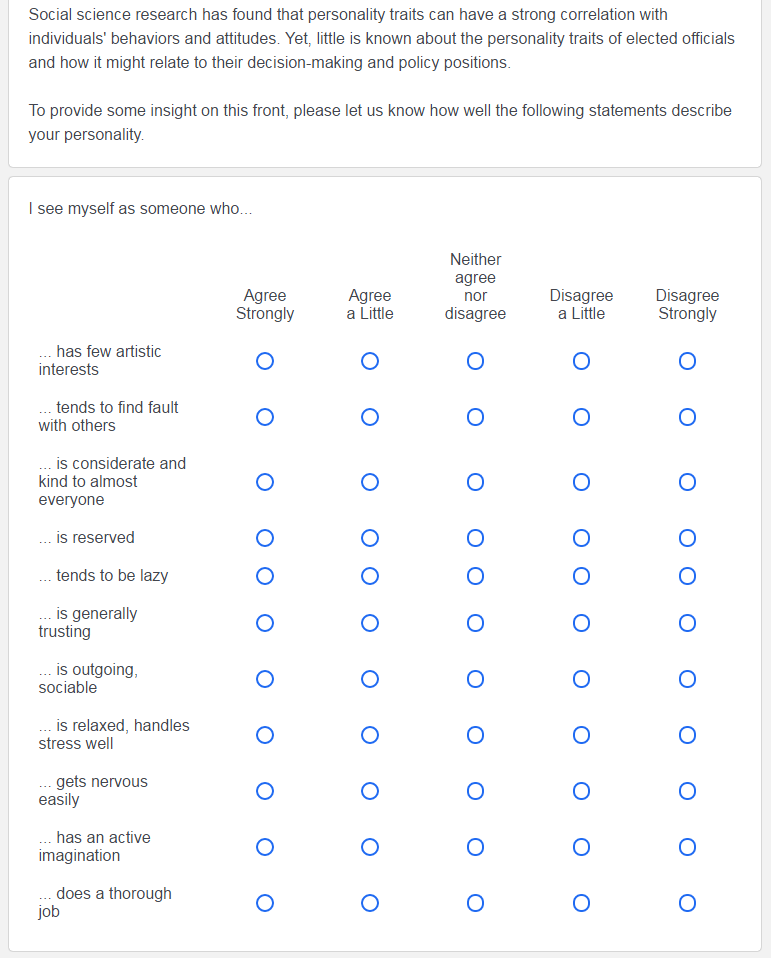
Here are the questions that were used to measure elected officials’ personality on these 5 traits.
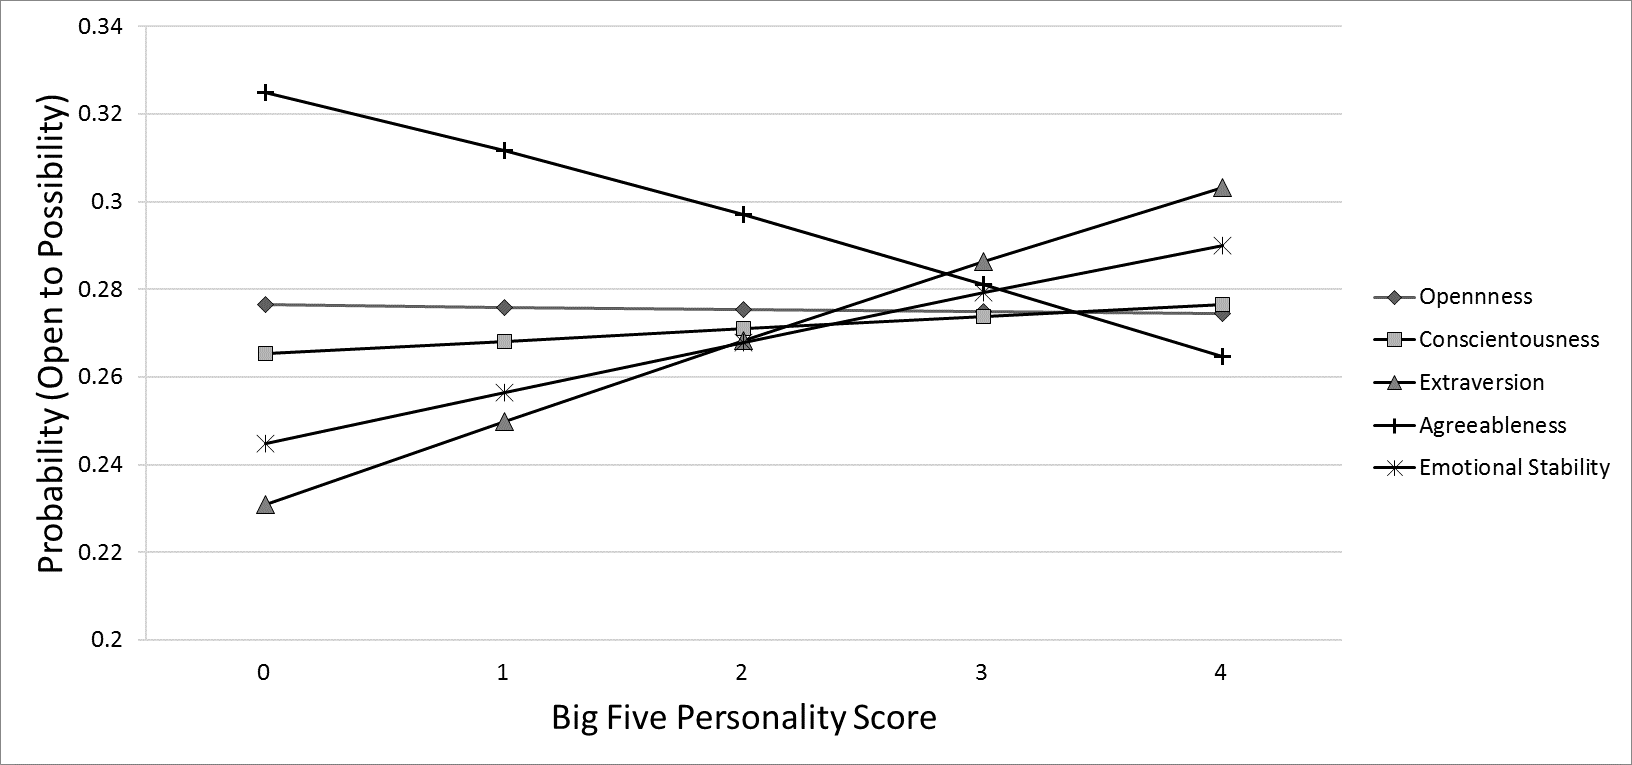
The first question we addressed with officials’ personality was whether those with certain personality traits are more likely to express interest in running for higher office. Below are graphs that compares the distribution of personality traits among the general population and municipal officials. Higher scores means that someone has higher levels of that particular trait:
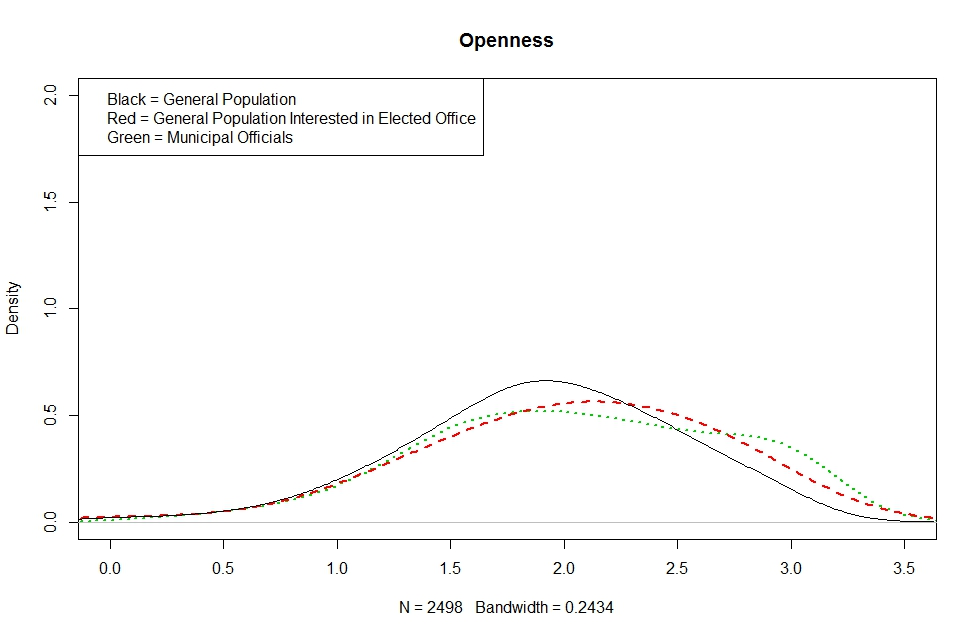
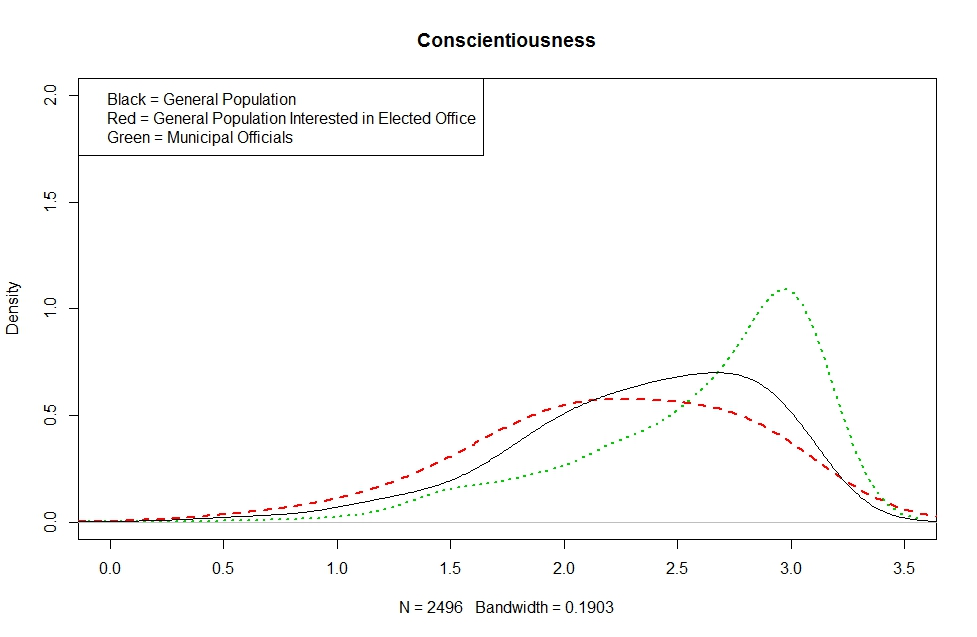
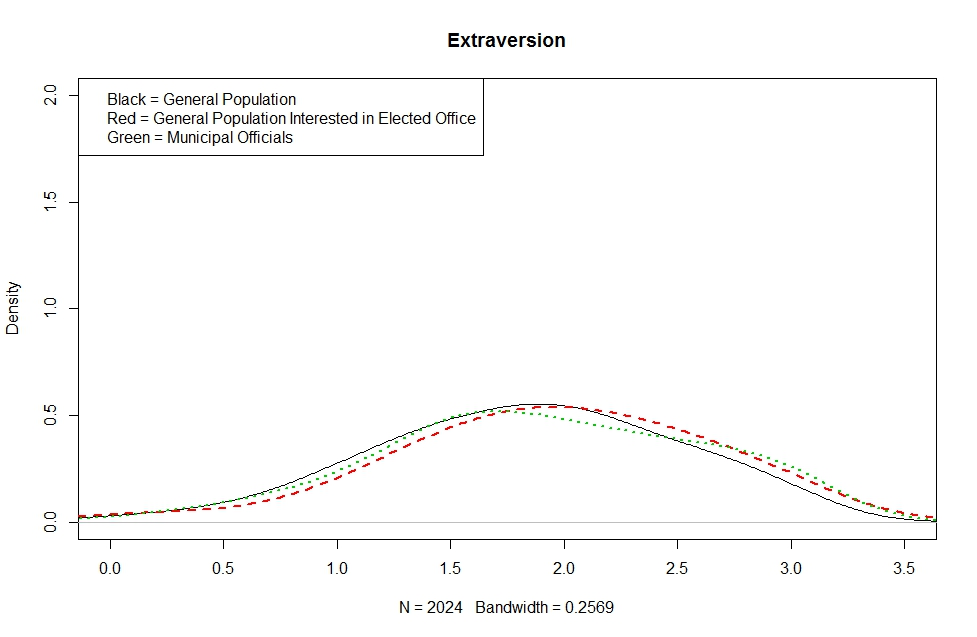
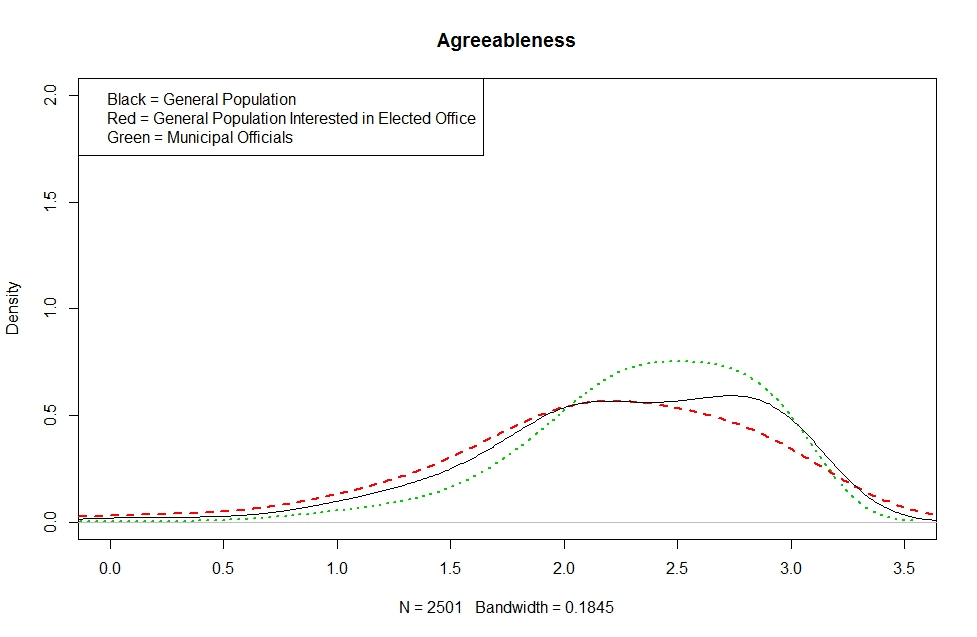
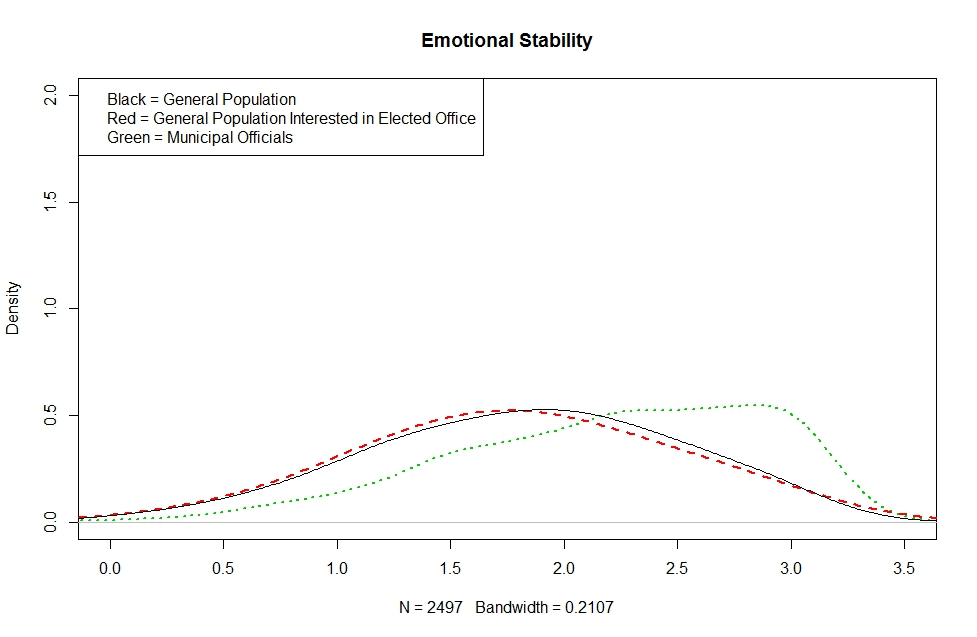
Overall, we find that elected officials are higher in terms of openness to experience, conscientiousness, agreeableness, and emotional stability. We expected that elected officials would also rate higher in extraversion. However, when we examined the personality traits associated with ambition for higher office among local officials, those with higher extraversion were much more likely to express a desire to run for higher office (see line with triangles). At the same time, those who are more agreeable, are less interested in higher office, which we think is consistent with the view (and perhaps reality) that state and national campaigns and governance is more partisan and contentious. The figure below displays these results even after controlling for a host of other variables that are likely correlated with a municipal official’s desire to run for higher office.
Ambition and Gender
Finally, a question of growing interest among scholars and practitioners is why are there fewer women than men in office? In one project, we wanted to examine whether the gap in the proportion of women in office was the same at the municipal level as at higher levels of office. One claim is that fewer women run for higher office because doing so is more demanding. Interestingly, we find that the gap is quite similar at the municipal level as it is at the state and national levels. In addition, we find that women who hold municipal office are just as ambitious for higher office as their male counterparts. This suggests that the main factor influencing women’s desire and ability to run operate at even the lowest levels of office, where the demands are different and perhaps lower.
As the upper half of the figure below illustrates, the percentage of women who are open to the possibility of running for office is much lower than the percentage of men who are open to doing so. Moreover, women are much more likely to express no interest in running. But among elected municipal officials (bottom half of figure), men and women express very similar levels of progressive ambition.
Figure: Differences in Ambition between Men and Women in the General Population and among Elected Local Officials
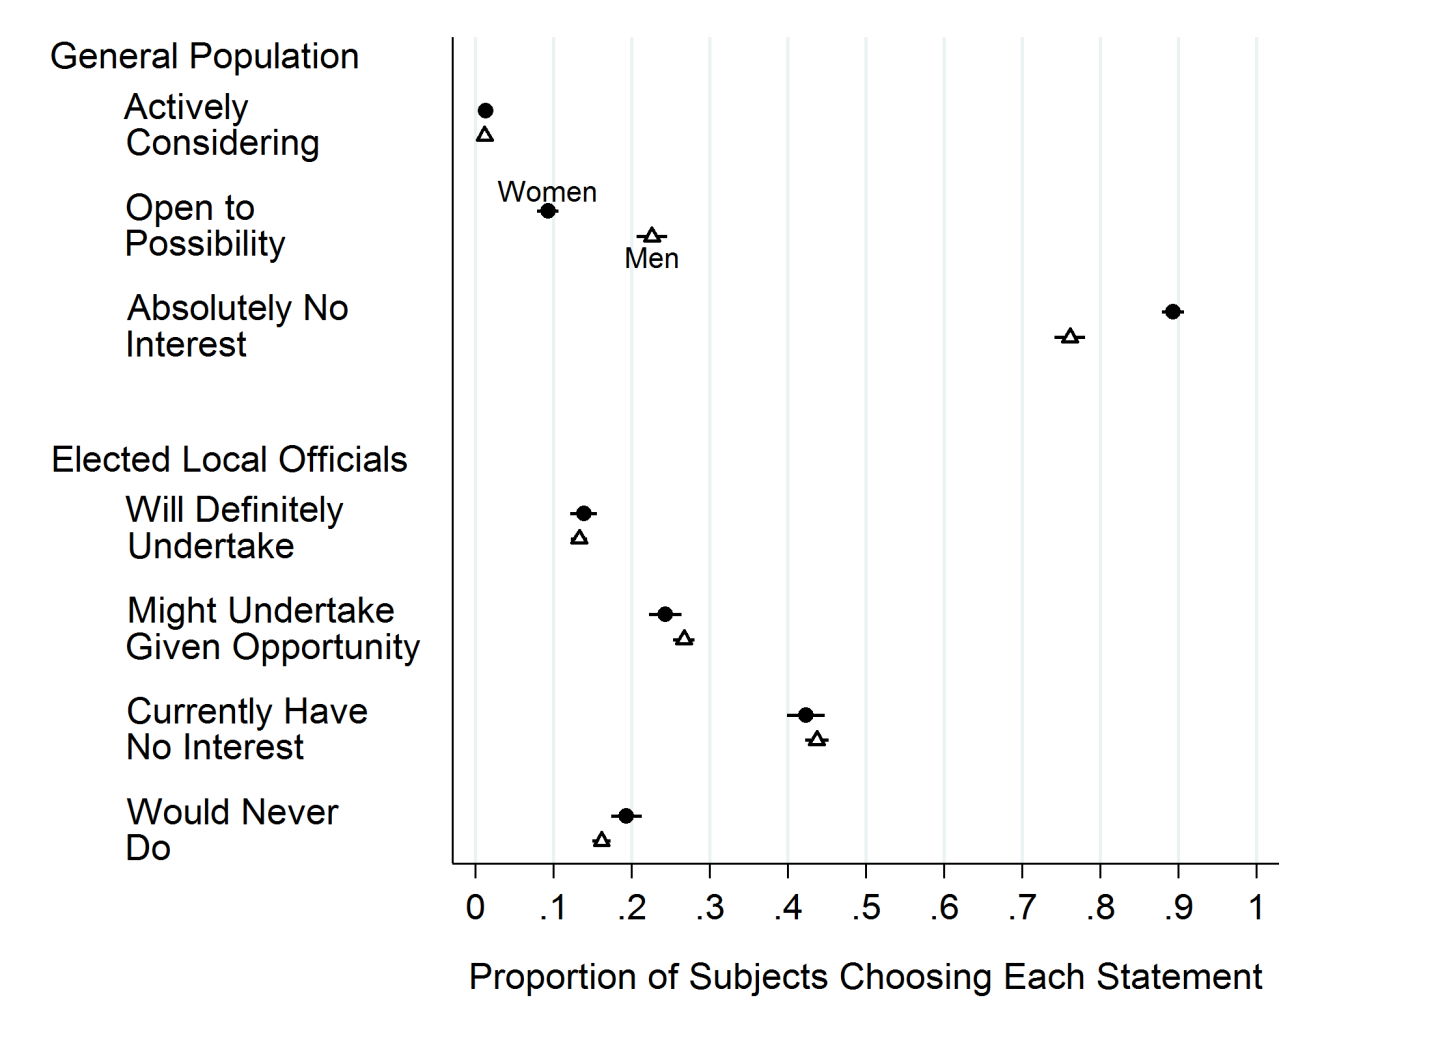
FIGURE NOTE: The figure shows proportion of women and men choosing each statement. In both surveys, subjects were asked the following: “Which of the following best characterizes your attitudes toward running for (higher) office in the future?” Black dots indicate the mean proportion of women choosing particular response. Hollow triangles indicate the mean proportion of men choosing a response. Black lines are 85% confidence intervals. If the black lines overlap, that means the difference between those two mean proportions are not statistically significant.